By Mary Sue O’Melia
When a customer waits at a bus stop, what is their expectation of when the bus will arrive? Did the agency post notices in advance regarding re-routes and detours for special events? Is there a “Bad Weather” schedule (e.g., operate lifeline service at lower frequencies)? Without communicating delays and changes, the customer feels everything should be as scheduled and the agency is either early, late or missing a trip.
Take the customers’ perspective when defining service reliability measures and standards.
Data definition
Schedule adherence is often measured as a percentage on-time – it could be the number of trips arriving on time or departing a time-point as scheduled. If a customer is at a bus stop looking at a stopwatch, what would they see as the bus arrives or departs the stop? On-time would be 00:00:00 to 00:05:59 – that is zero minutes early to five minutes late.
Agencies must also determine if they will measure departures, arrivals, or some combination of the two. Departure times are most common. Some agencies also include end of line arrival times and then exclude early arrivals. If agencies exclude early arrivals at the end of the line, are they perhaps allowing for early departures at stops between the last time point and the end of the line?
One way in which schedule adherence statistics may be manipulated is with “waivers.” This practice allows selected time-points for a specified period to be excluded from performance statistics.
Confused? Schedule adherence is a figure that seems fairly straightforward but is not.
Validating AVL equipment
If an agency is moving from manual checks for schedule adherence to a new AVL system, it should expect to see a dramatic decline in reported performance with AVL implementation. Manual data collection results typically result in reported on-time performance of 90 percent or better.
Some agencies blame it on the AVL system and never report AVL statistics to policy boards. A simple comparison of schedule adherence for manual versus ALV data by date, time, route, direction and time-point will quickly indicate if there is a problem with AVL equipment. Many times the difference in reported numbers results from a skewed sample for manual counts. If there is a system for randomly selecting time points for manual checks, then the AVL and manual count may be close. AVL systems provide significantly more data with which to make an assessment of performance.
 Performance standards
Realistically, the only way that urban service can achieve 95 percent or better is with a dedicated right-of-way, signal pre-emption, low bicycle and wheelchair boarding rates, low-floor vehicles, low ridership, cashless fare collection, extensive layover (schedule slack) and luck. Traffic sensors can predict travel times by automobile in major corridors at various time of day. Without some sort of signal pre-emption or right of way, buses are not going to be faster.
If an agency is reporting 90 percent or better schedule adherence, it may want to check your data collection methodology and/or data definitions.
Improving performance
Schedule adherence data is not required for National Transit Database (NTD) Reporting so the only reason to collect schedule adherence information is if the agency is going to use it to improve performance. Start by looking at overall performance by route. Then look at performance by day type (i.e., weekday, Saturday, and Sunday). Once a route by day type has been identified, analyses may be by direction and time of day, eventually getting down to the trip level.
Select a few routes to focus on with each run cut by analyzing:
- Average run time compared to scheduled run time
- Dwell times
- Factors impacting dwell times (e.g., loads, fare collection, lift deployments, bicycle loads, equipment assignment)
- Schedule adherence for trip departures and arrivals
- Layover time
- Schedule adherence by bus operator
Conclusion
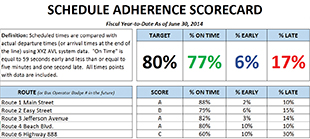
Improving schedule adherence requires involvement by the full team (e.g., bus operators, road supervisors, schedulers/planners, dispatch). Involvement starts with posting KPIs and performance results. A typical schedule adherence performance scorecard designed by bus operators from one division is shown below. An agency cannot win if the team does not know the score. Data definitions, collection of information, measurement and analyses are all just background for the team to come up with strategies and actions to improve service reliability as measured by adherence to published time schedules.
Mary Sue O’Melia is president of TransTrack Systems®, Inc., a business intelligence solution that transforms volumes of data into meaningful information for transportation managers and executives to use in planning, strategizing and ensuring optimal performance Visit TransTrack Systems® at: www.transtrack.net .