By Mary Sue O’Melia
Transit agencies are overwhelmed with data but have very little business intelligence. This is the first in a series of articles exploring business intelligence for the transit industry.
—————————————————————————————————————————————
YOU MIGHT ALSO LIKE:
—————————————————————————————————————————————
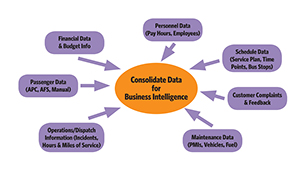
Data overload
Collecting and maintaining data is expensive and time-consuming. Each department typically maintains a separate data system and these systems may not be integrated. Basic data, such as number of passengers, may have three separate and disparate numbers – one passenger number from the automated fare system (AFS), another number from automated passenger counters (APC), and a third number based on manual counts used to validate APC data. Data may reside in separate systems and no two numbers ever agree. In this case, the basis for performance data is inaccessible or fragmented and thus credibility and reliability are often impacted by data inconsistencies.
Consolidating data in an easy-to-use reporting system is a starting point for addressing data overload and fragmentation. In discussions about the numbers, there should never be any confusion about the accuracy of the data. The goal is to have data immediately available for tactical decision-making.
Business intelligence defined
Wikipedia defines business intelligence as the “transformation of raw data into meaningful and useful information for business analysis purposes.”
Business intelligence is characterized by:
• A set of clear performance indicators that concisely convey the financial, service and safety performance of the agency
• The tools, processes and personnel to continually evaluate and improve agency performance
• The capability to identify challenges and opportunities, as well as the knowledge to take appropriate action
Next stop – BI for the transit industry
What this means in practical terms is that management wants a system of Key Performance Indicators (KPI) and dashboards that provide accurate and timely information for strategic decision-making. Supervisors and mid-level management want information for tactical decision-making to improve performance. Managers require information in sufficient detail to make daily decisions with confidence and assurance that the data is correct and accurate. This implies more detailed reporting and dashboard drilldowns. Data managers require an effective process to collect and report information that does not involve re-keying data from multiple databases and sources. IT Managers require systems, tools and services to support the BI program.
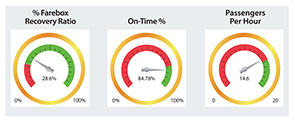
Speedometers and gauges appear to be the pre-dominant symbol for executive- level dashboards, designed to focus attention on a performance issue. These are the pointers; not the answer or reason for performance results. New BI tools focus on conveying maximum information at a glance.
 BI – How to get there
BI applied to the transit industry can help reduce costs, increase passenger revenue, streamline operations and improve safety and service quality. Implementation of a successful BI program requires:
• Involvement by top management and full participation by data managers and process owners throughout the life of the BI program
• Identification of key indicators for measuring performance and agreement on data definitions and sources
• Elimination of time-consuming data reconciliations by obtaining data at the source and centralization of data storage and reporting
• Involving the entire team in a collaborative effort to establish targets, analyze performance results and develop of improvement strategies
A successful BI implementation empowers employees at every level of the organization to make better decisions. Critical transit data needs to be accessible to all employees so they can perform their own analyses and collaborate with team members on fact-based improvement strategies. With access to relevant data, displayed as useful information, employees can find opportunities to operate more efficiently and safely, helping your transit agency achieve strategic objectives.
Agencies that report to the National Transit Database (NTD) already have a start on collecting information used in assessing transit performance. The next installment addresses key performance indicators (KPI) for transit and potential sources and information drill-downs.
Mary Sue O’Melia is president of TransTrack Systems®, a business intelligence solution that transforms volumes of data into meaningful information for transportation managers and executives to use in planning, strategizing and ensuring optimal performance. Visit TransTrack Systems® at: www.transtrack.net