Aon Risk Solutions 2011 Public Transit Liability Benchmark Analysis
By Terry C. Pfeifer

The Aon Risk Solutions 2011 Public Transit Liability Benchmark Analysis provides public transit risk managers with a better understanding of the liability cost of risk. The study found significant differences in both the frequency and severity of liability claims for bus operations compared to those of rail operations.
Over the last five accident years public transit liability costs have been increasing slightly. Since 2006 there was a 3 percent average annual loss rate increase, a 1 percent average annual claim frequency increase and a 2 percent average annual claim severity increase.
Findings expressed numerically
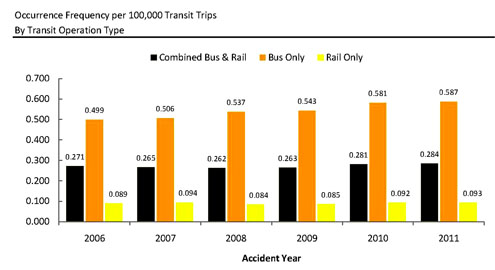
The Aon study shows that while the average dollar severity of a rail liability occurrence is higher than a bus occurrence, the much higher frequency of liability occurrences associated with bus operations is a key driver of the overall cost of liability claims.
Projected 2011 frequency was one occurrence per 1.075 million rail transit trips, and one occurrence per 170,000 bus transit trips

Projected 2011 severity was $31,300 for rail operations and $21,000 for bus operations
Projected 2011 loss rate was 2.9 cents per rail transit trip and 12.3 cents per bus transit trip
A closer examination of the nature of bus operations compared to rail operations further explains these findings. As buses interact with pedestrians and other road traffic there is a greater potential for incidents leading to liability claims. While these claims can sometimes be severe or expensive, many others only relate to minor fender-bender incidents, which drive down the overall average bus liability claim severity. On the other hand, rail operations tend to operate on dedicated tracks with little or no interaction with pedestrians and vehicular traffic. While there are sometimes very severe rail occurrences, these are relatively rare, but they do drive up the average claim cost of rail occurrences.
Additionally, a small number of severe transit claims can result in a very large dollar amount of liability losses. As shown in this study an analysis of the distribution of public transit liability claims by dollar value revealed that 95 percent of public transit liability claims have dollar values of $50,000 or less, while a very small number of liability claims have dollar values of $1 million or larger. If these severe claims can be avoided or mitigated in the future, there is the potential for significant savings in public transit liability claims.

Public transit liability trends upward
Several factors are driving the increases in public transit liability. Outside pressures, such as medical cost inflation, have significantly contributed to the increase in the severity of public transit liability claims. Also many insurance experts have theorized that the current economic environment leads to an increase in the frequency of liability claims of all types. Some public transit risk managers also speculate that transit liability claims increase as less-experienced operators begin to replace older, more experienced transit vehicle drivers as they retire.
Public transit vehicle fleets and infrastructures are beginning to show signs of aging. While some transit systems more than 100 years old have long dealt with maintaining an aging system, many other transit systems as young as 40 are beginning to deal with the challenges of sustaining an their original infrastructure.
Even when transit agencies perform diligent maintenance breakdowns in aging equipment can still lead to an increase in liability generating occurrences. Aging public transit infrastructure and an older workforce underscore the need for effective loss control, training and system and vehicle maintenance or replacement. These measures can help mitigate future increases and perhaps even lead to reductions in liability claim frequency and severity.
The future of ridership
Effective loss control will become even more important in the future as public transit ridership is likely to continue to increase nationwide. History shows that public transit ridership has consistently increased, not only because of population growth but also because of its advantages during times of economic growth. A strong economy leads to an increase in commuting workers as well as an increase in the number of riders who use public transit for leisure activity travels. Although public transit ridership growth has been somewhat flat in recent years, the transit industry can expect significant increases in ridership as the economy recovers. BR
Terry C. Pfeifer serves as a senior consultant for Aon Risk Solutions, Chicago, IL.