Innovation comes from self-awareness gained by revisiting collected data
By Mary Jo Wagner

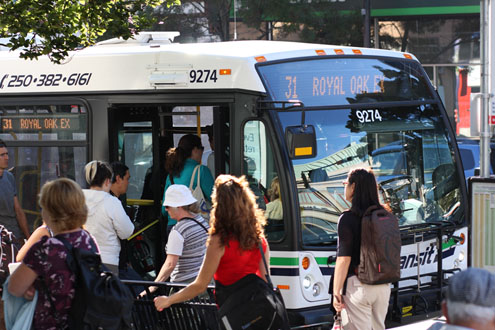
It is a familiar sight in every city: people at bus stops straining to spot their bus in the distance. Michael Grant, manager of monitoring and forecasting for BC Transit, Victoria, BC, Canada, was such a person when he first moved to Victoria BC two years ago.
“As a regular commuter, I found navigating on public transit a bit difficult,” says Grant. “I remember sharing in the frustration of that great transit mystery: When will the bus actually arrive?”
Such uncertainty is detrimental to customer loyalty, says Grant. He could see BC Transit needed to know more about its own network before it could inform its customers. Although the agency had collected data for decades on bus stops, vehicles, schedules, routes and ridership, it failed to truly understand the value and utility of transit data to improve service.
All that has changed with the monitoring and forecasting department Grant created two years ago. His small team now collects data, makes useful connections, creates new routes of data flows and plots automated processes to know the which, where and when of any given bus at any given time.
Transit through time
BC Transit manages and maintains 81 transit systems across British Columbia with a fleet of more than 1,000 vehicles that served more than 49 million passengers in 2010.
As its ridership surged and the fleet has grown, BC Transit has adopted technology to maintain, track and analyze its growing assets and operations.
The agency had implemented technological solutions, many of which require manual data-input processes, as individual modes, leaving employees with highly individualized knowledge of particular aspects, rather than a more holistic interactive view of the entire system.
Without a checks-and-balances system to ensure quality and accuracy of its data, the agency became mired by its inability to identify and map the operational facets of its buses and its riders. The existing systems were unable to convert and connect the datasets into a comprehensive view of passenger volume and the transit network at any given time.
“By aligning our automated passenger count with the stops, routes and schedules, we can map the top 50 stops people use,” says Grant. “Or, we can show all the routes together in the downtown core to see when people get off one bus and transfer to another. Our present system is a far more complete, informative and intuitive way to analyze and visualize our business.”
Using spatial data-transformation technology to develop those essential links, Grant’s team cleared out data debris, standardized data components and built automated workflows to create a well-oiled transmission of transit information to improve productivity and service to customers.
First stop, bus stops
The Bus Stop Management System (BSMS) was the first stop on this data revamp, begun as a stand alone tool in 2009 to enable transit personnel to view and manage bus stops online.
With 80 different transit systems and 8,000 existing bus stops throughout British Columbia, BSMS provided a simple platform to add, delete, move or change bus stop attributes. However, manual data entry left the data vulnerable to errors, inconsistencies and inaccuracies.
Starting with the Victoria Regional Transit System (VRTS) network of 2,500 bus stops, using Safe Software FME spatial data-transformation technology, Grant’s team launched an initiative to both standardize the BSMS data capture and to automate the process for creating bus stop names and addresses.
“We now have a standard naming convention for each stop that includes the road name, direction of travel and location of the closest intersection,” he says. “This standardization and automation has not only reduced errors in the BSMS, it has created the consistency we needed.”

Olympic proportions
The Vancouver Olympic Committee approached BC Transit in December 2009 with a request to post information for the Whistler area on Google Maps for Transit. Although BC Transit had not planned on participating, Grant could see Google Transit would greatly benefit tech-savvy customers.
Knowing data preparation would pose the most significant challenge, Grant first matched the required information to the existing data available, a process he says momentarily stopped him in his tracks. Google Transit requires every bus stop to have a stop ID noting its name and latitude/longitude location.
In Whistler, schedulers only scheduled for timing points, typically the start, middle and end of a route, and not specific bus stops. The more than 380 stops in the Whistler/Squamish/Pemberton area left a lot of gaps to fill in a distance of 120 miles.
Working closely with the schedulers and using automatic bus stop naming workflow, Grant expedited the process to identify all of the timing points and each bus stop and give each stop an ID. He then exported the integrated bus stop and scheduling information to the Google Transit GTFS format and ran a quality-assurance workflow to ensure all the data was aligned properly. In one month, the Whistler transit information was ready for service.
“The ability to quickly and accurately prepare and integrate our needed data sources, a nearly impossible task to do manually, enabled us to meet the deadline,” he says. “It provided us with a workflow template so we can easily sustain this data service as well as put other BC communities on the Google Transit map.”
Since its Olympic debut, the department has used the same customized data-transformation process to add Victoria’s 263 conventional bus routes and schedules and 2,430 stops to Google Transit, and is nearing completion for Kelowna’s transit system.
Not exactly A to B
With scheduling and BSMS workflows humming, it was time to apply same streamlined processing to building transit routes. Contrary to common belief, a route is not just a line from point A to point B, but rather a series of directional patterns. Some routes contain more than 20 patterns. Victoria alone has 110 route patterns, which means every time BC Transit issued a new quarterly schedule, the staff had to rebuild the patterns and routes manually rebuilt. Basically, it was an unsustainable process.
Today, with each new schedule the customized workflow automatically integrates the scheduling data and identifies each from stop to stop pair specific to each pattern along a route, reducing this routine task from days to minutes.
“This frees us up to focus on higher-level analysis to improve business,” says Grant. “We can study stop-to-stop distances to determine if our stops are too close together or too far apart. We can map the routes more simply, or use them to analyze how many people are on a bus at a given time.”
Where to now
Passenger information was one of the last data nuggets to be revamped, the ultimate measure of how well a transit agency is meeting travel needs. Although BC Transit has had two different passenger-data collection systems on board buses — automated passenger counters (APC) and FareBox technology — the “black box” nature of the APC data has made it difficult to integrate into usable, GIS-based information.
Today using FME to convert that information into usable data, the agency can integrate the scheduling data with the APC data and determine the location of each of those 30-second point records along the road network. Users can then produce color-coded maps or animations of any bus route and immediately see the ebb and flow of passenger traffic on the vehicle.
From information garnered from a swiped bus pass, the team can plot out an individual’s travel patterns and design better service. Grant says such smart service moves only strengthen the option for transit. BR
Mary Jo Wagner is a freelance editor and media consultant based in Vancouver, BC, Canada.
