By Mary Sue O’Melia
With the technology available today, the transit industry has more data than ever to help plan productive and efficient service. But more data does not necessarily translate into good planning decisions and improved performance.
Drilldown not up
Agencies should start at the Route level by Day Type (i.e., Weekday, Saturday, and Sunday). Drilldowns to the trip and stop levels are done on an as-needed basis and require APC and AVL system data. Picking a year or even a month’s worth of detailed data without having a framework for evaluation is a waste of time.
Evaluating productivity and effectiveness
Agencies will need four data items that are required for National Transit Database (NTD) reporting and are generally available to all transit agencies, both large and small. The four data items include:
• Passengers
• Revenue Service Hours (or Revenue Service Miles)
• Passenger Revenues
• Operating Costs
Calculate system average and individual route performance statistics for key indicators: passengers per revenue hour and farebox recovery ratio (i.e., passenger revenue divided by operating costs) or subsidy per passenger (in lieu of farebox recovery). Use these two indicators to assess areas of strong, moderate and poor performance. Display information in a diagram or table format.
In the example that follows, Quadrant A shows strong performance while quadrants B and C (shown in gray) show moderate performance. Quadrant D is shown in red and indicates poor performance.
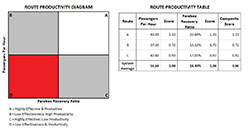
In the example above, Route B has the lowest performance in the group. The next drill down would be to examine performance by day type, followed by performance by time of day (e.g., early morning, AM peak, mid-day, PM peak, evening) and then by route segment. Examining route performance by day type may be accomplished with standard data by route used for NTD reporting. Identifying performance issues by time of day and route segment requires a ride check or APC data.
Route performance standards
Many agencies go through an elaborate process to define route performance standards, but using your own transit system average for general public service is fairly easy to calculate and levels the playing field. This allows for a few basic service planning guidelines. If an agency wants to improve system performance, the first rule is this: Do not implement service changes that are going to result in performance below the system average.
The second rule: People will walk to frequency. Invest in improving the frequency of the best routes.
Evaluating service change requests
Attend almost any public hearing for transit services and there will be requests for:
• New routes in new areas
• Expanded service hours
• Weekend service
• Additional stops
• More frequent service
• More reliable service
• Faster service.
Evaluating options does not require complex formulas. How do existing services in similar areas and during the same hours and days of operation perform? If service changes perform in the same way as existing services, will the route be above or below the system average after these changes?
For additional stops and off-route stops, a different type of analysis is required. How much running time will be added with additional and/or off route stops? Is there enough slack in the schedule to accommodate a few additional stops? Are additional vehicles required to accomplish the requested change?
Answering these questions can go a long way to presenting the facts for performance-based decision-making. Transit managers should not be recommending routes expected to have poor performance based on comments received during a public hearing or because it would be nice to expand service.
If an agency is venturing into expanded hours and days, and there are no similar routes, then implement the service on a demonstration basis with clearly communicated performance standards.
Summarize up before making a final decision
Once a set of service changes have been identified and vetted, the cumulative impact of these changes should be evaluated. What is the current system average for key performance statistics and will these improve, decline or stay the same with implementation of recommended changes? If an agency does not know the answer to this question, then it is not ready to make the change. Don’t guess; know before you recommend and approve.
Mary Sue O’Melia is president of TransTrack Systems®, Inc., a business intelligence solution that transforms volumes of data into meaningful information for transportation managers and executives to use in planning, strategizing and ensuring optimal performance. Visit TransTrack Systems® at: www.transtrack.net.